Color palettes inspired by the shields of Carioca Samba Schools. Complete
list of palette colors and the shields that inspired them can be found
on Github. Use
colorblind_friendly() to check whether palettes are colorblind-friendly.
Arguments
- palette_name
Name of Palette. Choices are:
Beija_Flor,Grande_Rio,Imperatriz_Leopoldinense,Imperio_Serrano,Mangueira,Padre_Miguel,Paraiso_Tuiuti,Portela,Salgueiro,Sao_Clemente,Tijuca,Uniao_Ilha,Vila_Isabel,Viradouro.- n
Number of desired colors. If number of requested colors is beyond the scope of the palette, colors are automatically interpolated. If n is not provided, the length of the palette is used.
- type
Either "continuous" or "discrete". Use continuous if you want to automatically interpolate between colors.
- direction
Sets order of colors. Default palette is 1. If direction is -1, palette color order is reversed
- override.order
Colors are picked from palette to maximize readability and aesthetics. This means that colors are not always selected in sequential order from the full palette. If override.order is set to TRUE, colors are selected in sequential order from the full palette instead. Default is FALSE.
Examples
# Shows the Beija Flor palette
rio_paletter("Beija_Flor")
 # Shows the Grande Rio palette in the reverse direction
rio_paletter("Grande_Rio", direction=-1)
# Shows the Grande Rio palette in the reverse direction
rio_paletter("Grande_Rio", direction=-1)
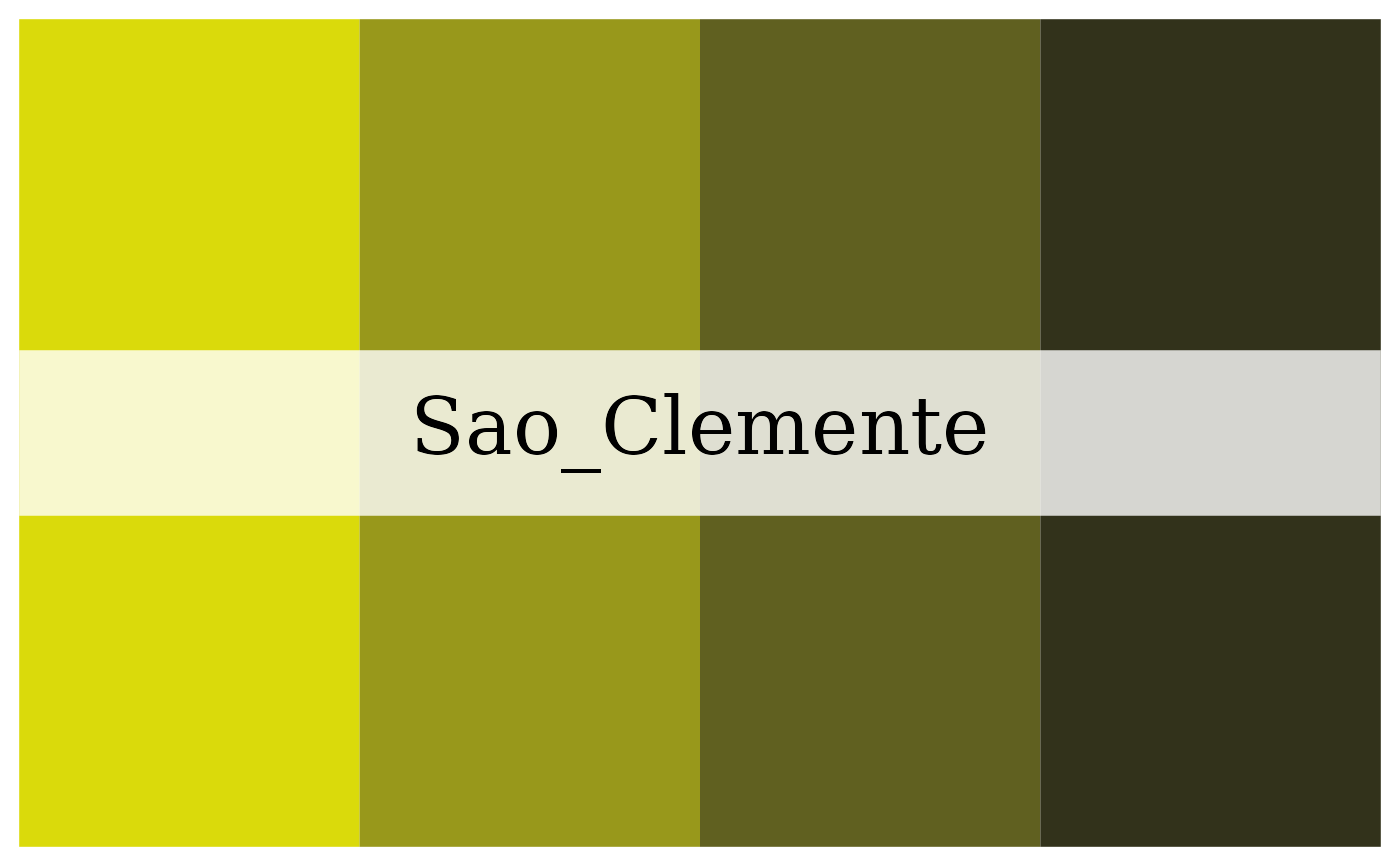
 # Shows four colors of the São Clemente palette in the print order
rio_paletter("Sao_Clemente", 4, override.order=TRUE)
# Shows four colors of the São Clemente palette in the print order
rio_paletter("Sao_Clemente", 4, override.order=TRUE)
 # Gets the scores of Império Serrano, Mangueira and Padre Miguel
# from 1968 until 2018 on the Bateria criterion.
# Throws some warnings to inform the user which years are absent of the data
# (either from missing info or because the school didn't compete in the main league)
df <- get_scores(years = 1968:2018,
schools = c("Império Serrano",
"Estação primeira de Mangueira",
"Mocidade independente de Padre Miguel"),
criterions = "BATERIA")
#> Warning: Your selection does not contains: 1982, 1983, 1984
# Loads ggplot2 and dplyr
library(ggplot2)
library(dplyr)
#>
#> Attaching package: ‘dplyr’
#> The following objects are masked from ‘package:stats’:
#>
#> filter, lag
#> The following objects are masked from ‘package:base’:
#>
#> intersect, setdiff, setequal, union
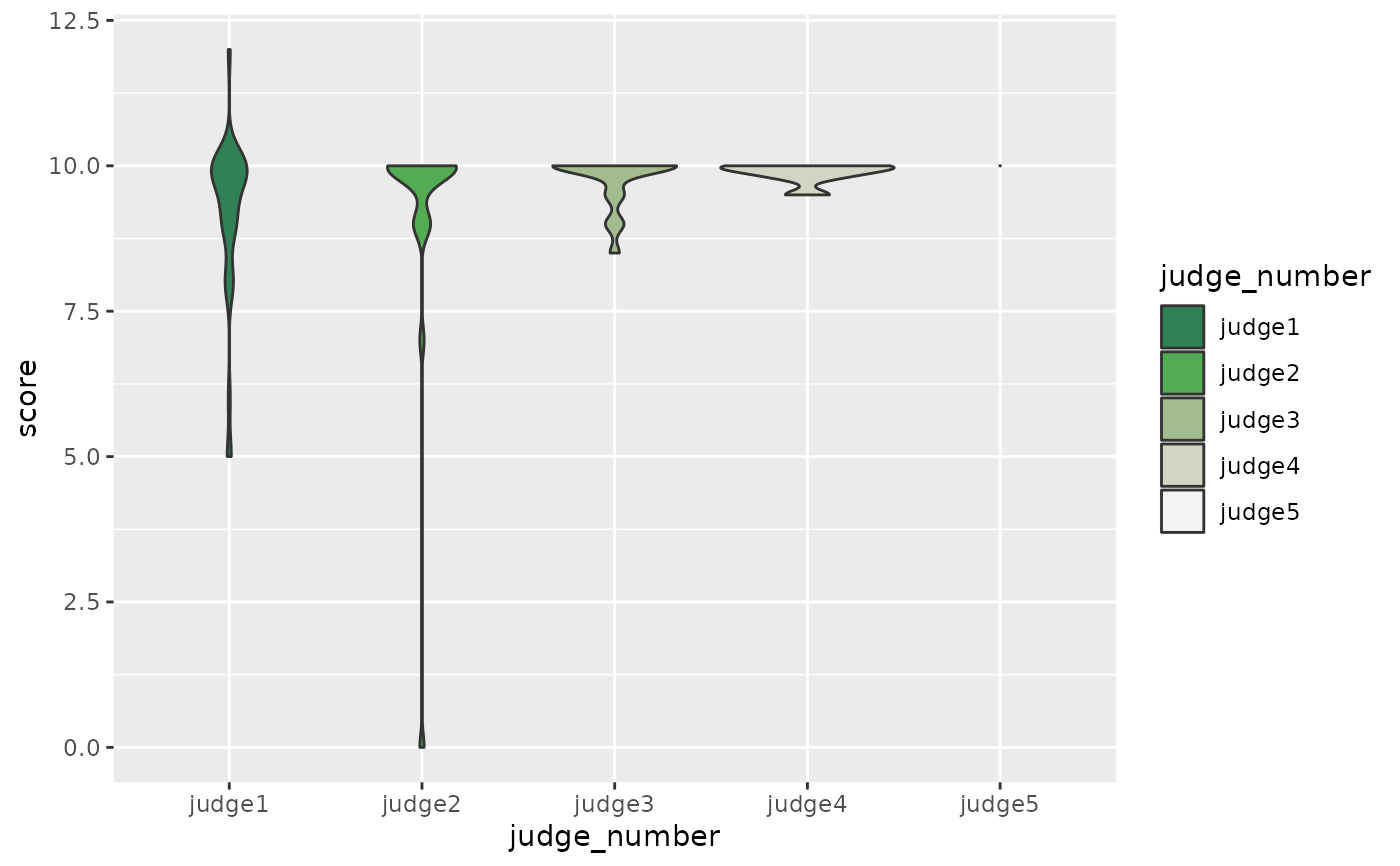
# Creates a plot and applies manually the palette of Império Serrano
df |>
filter(school == "Império Serrano") |>
ggplot(aes(x = judge_number, y = score, fill = judge_number)) +
geom_violin() +
scale_fill_manual(values = rio_paletter("Imperio_Serrano", 5))
# Gets the scores of Império Serrano, Mangueira and Padre Miguel
# from 1968 until 2018 on the Bateria criterion.
# Throws some warnings to inform the user which years are absent of the data
# (either from missing info or because the school didn't compete in the main league)
df <- get_scores(years = 1968:2018,
schools = c("Império Serrano",
"Estação primeira de Mangueira",
"Mocidade independente de Padre Miguel"),
criterions = "BATERIA")
#> Warning: Your selection does not contains: 1982, 1983, 1984
# Loads ggplot2 and dplyr
library(ggplot2)
library(dplyr)
#>
#> Attaching package: ‘dplyr’
#> The following objects are masked from ‘package:stats’:
#>
#> filter, lag
#> The following objects are masked from ‘package:base’:
#>
#> intersect, setdiff, setequal, union
# Creates a plot and applies manually the palette of Império Serrano
df |>
filter(school == "Império Serrano") |>
ggplot(aes(x = judge_number, y = score, fill = judge_number)) +
geom_violin() +
scale_fill_manual(values = rio_paletter("Imperio_Serrano", 5))
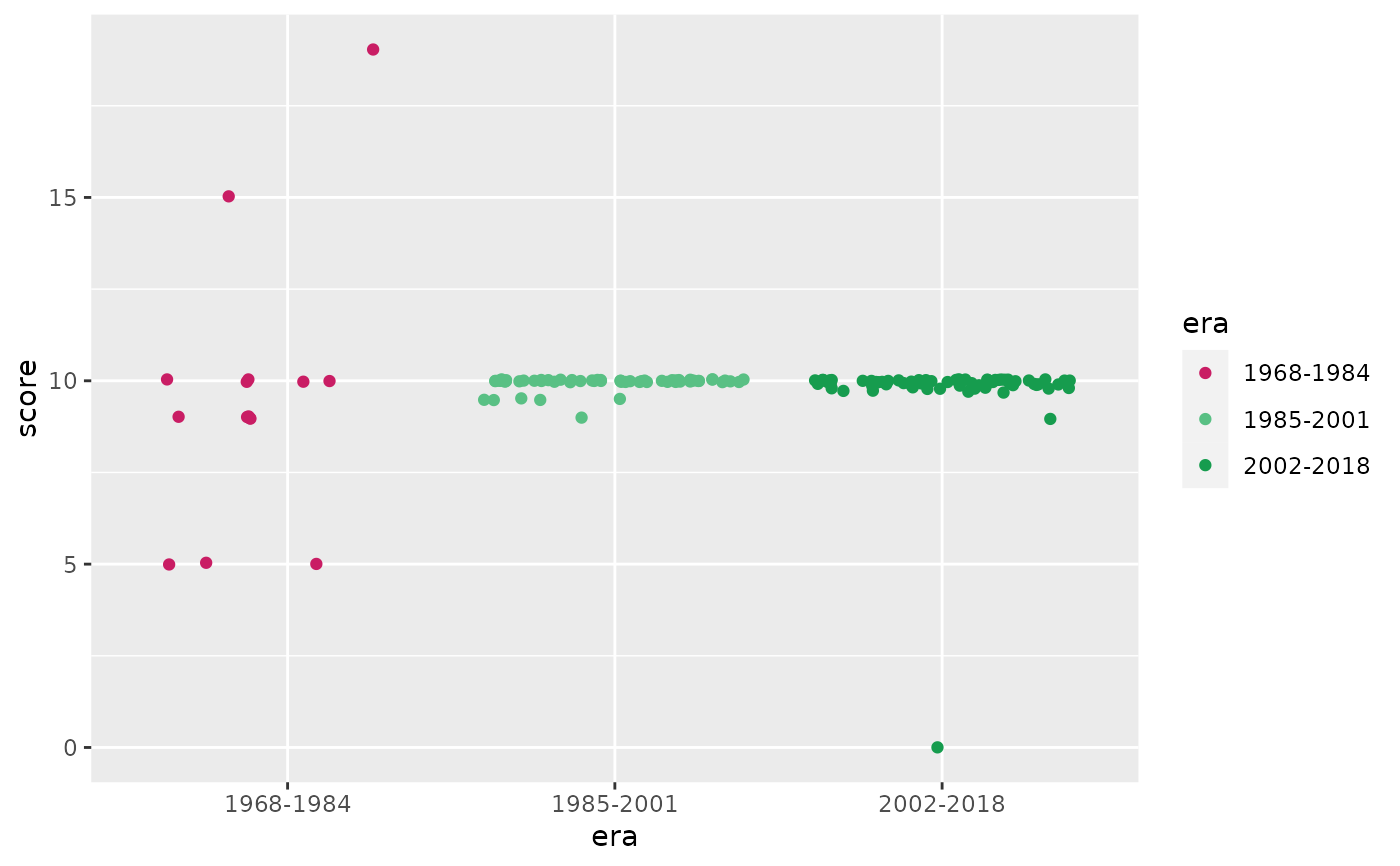
 # Creates a plot and applies manually three colors from the palette of Mangueira
df |>
filter(school == "Estação Primeira de Mangueira") |>
mutate(era = case_when(
between(year, 1968, 1984) ~ "1968-1984",
between(year, 1985, 2001) ~ "1985-2001",
between(year, 2002, 2018) ~ "2002-2018"
)) |>
ggplot(aes(x = era, y = score, color = era)) +
geom_jitter() +
scale_color_manual(values = rio_paletter("Mangueira", 3))
# Creates a plot and applies manually three colors from the palette of Mangueira
df |>
filter(school == "Estação Primeira de Mangueira") |>
mutate(era = case_when(
between(year, 1968, 1984) ~ "1968-1984",
between(year, 1985, 2001) ~ "1985-2001",
between(year, 2002, 2018) ~ "2002-2018"
)) |>
ggplot(aes(x = era, y = score, color = era)) +
geom_jitter() +
scale_color_manual(values = rio_paletter("Mangueira", 3))
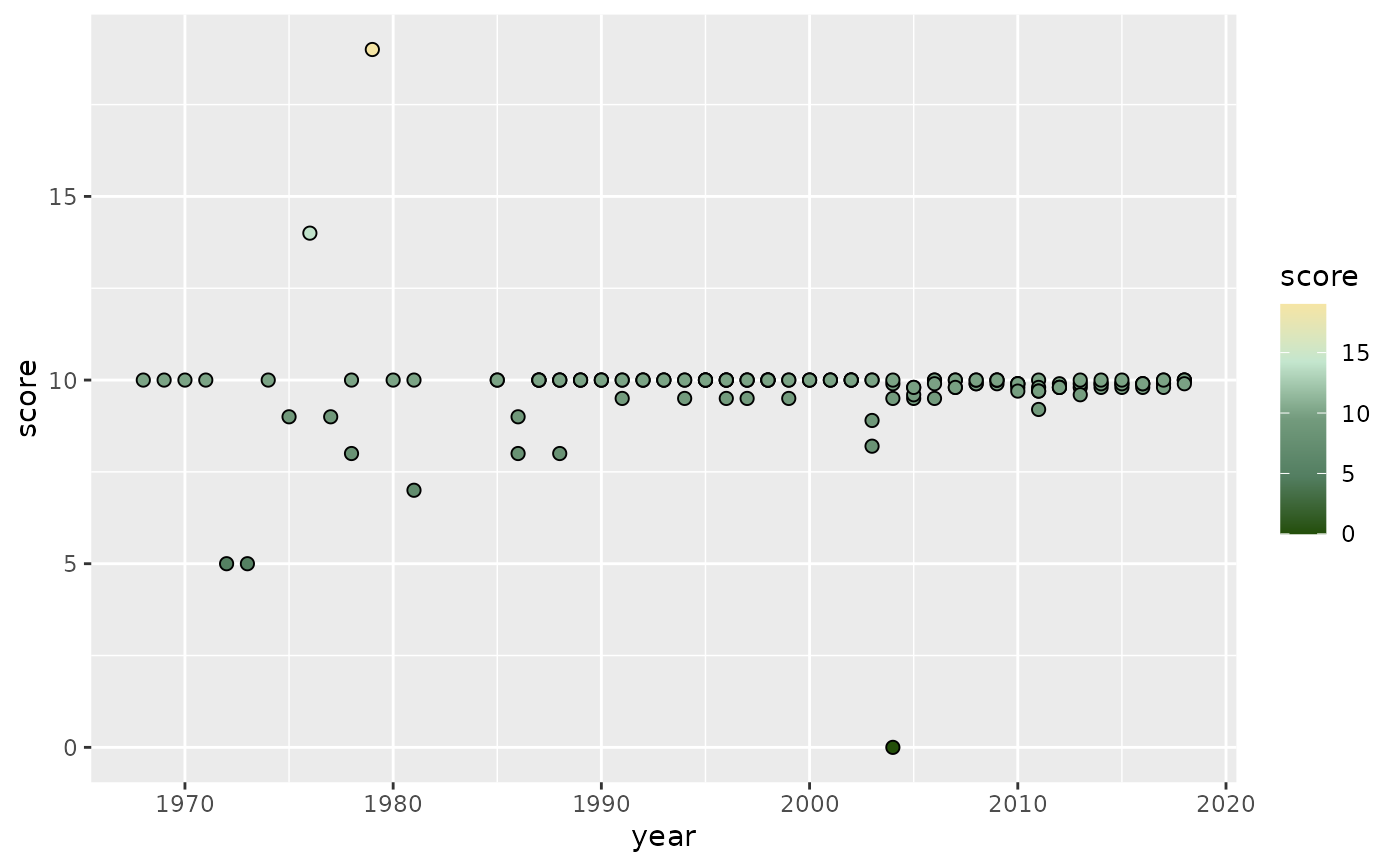
 # Creates a plot and applies manually a gradient inspired by the palette of Padre Miguel
df |>
filter(school == "Mocidade Independente de Padre Miguel") |>
ggplot(aes(x = year, y = score, fill = score)) +
geom_point(color = "black", shape = 21, size = 2) +
scale_fill_gradientn(colors = rio_paletter("Padre_Miguel"))
# Creates a plot and applies manually a gradient inspired by the palette of Padre Miguel
df |>
filter(school == "Mocidade Independente de Padre Miguel") |>
ggplot(aes(x = year, y = score, fill = score)) +
geom_point(color = "black", shape = 21, size = 2) +
scale_fill_gradientn(colors = rio_paletter("Padre_Miguel"))